WeatherAlert is a real-time weather monitoring and alerting platform. It continuously polls the OpenWeather API for multiple configured locations, stores historical readings, and sends SMS and email alerts when user-defined thresholds are exceeded. The web interface provides a live map dashboard, historical trend charts, and a full administration console.
| Role | Who | Capabilities |
|---|---|---|
| Viewer | Any unauthenticated visitor | View Map dashboard, view Trends page (read-only) |
| User | Registered & email-verified accounts | All Viewer rights + manage personal Locations, toggle own alerts, update Profile |
| Admin | Accounts promoted by Superadmin | All User rights + edit Alert Thresholds, view Activity / SMS / Email Logs, toggle Global Alerts |
| Superadmin | System owner (first account or manually assigned) | All Admin rights + manage all Users, access System Settings, change poll intervals |
The Dashboard is the default landing page. It shows a live weather panel for any location you select on the interactive map. No login is required to view it.
- Click any blue pin on the map to load live weather for that location.
- Use the search box (top-right of the map) to find any location by name or coordinates. Press Enter to add a temporary pin.
- Scroll to zoom; drag to pan.
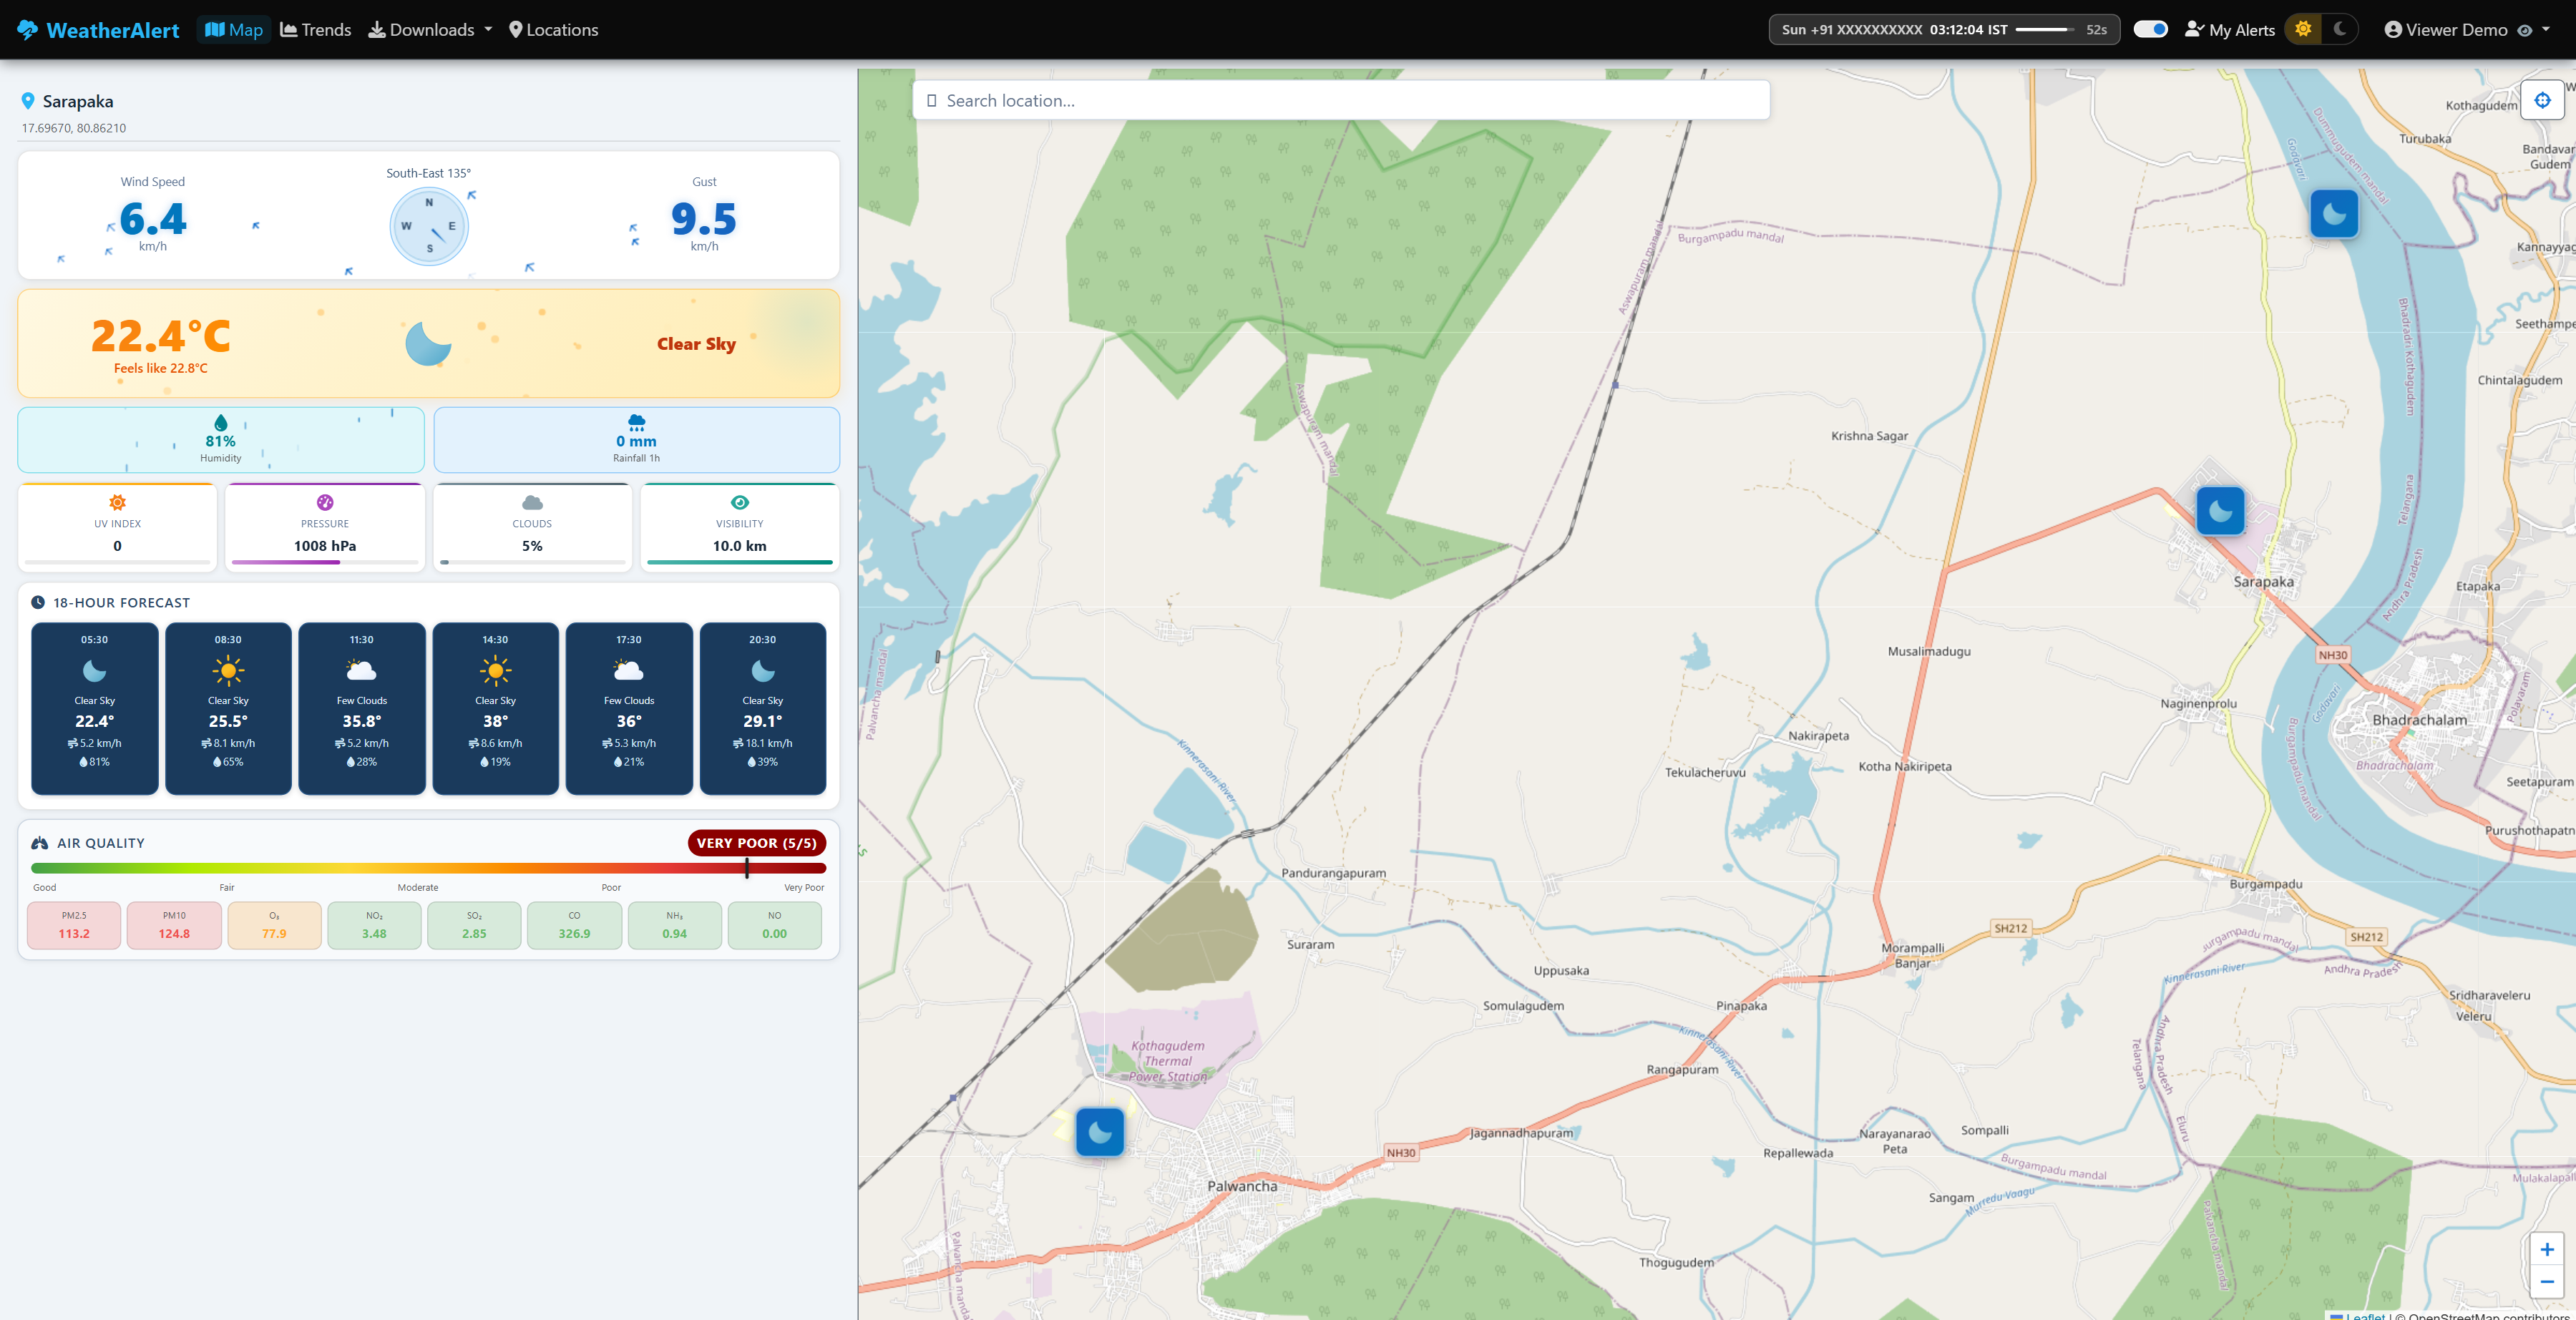
The top card shows an animated particle canvas representing wind flow, a central compass that rotates to true bearing, and the cardinal direction label (e.g. "South 159°"). Wind speed is on the left; gust on the right.
Shows the current temperature in a large font with live colour that shifts from blue (cold) through green to red (heat). "Feels like" is shown below. The centre column shows the official OpenWeather condition icon; the right column shows the text description (e.g., "Clear Sky", "Light Rain").
A row of stat tiles below the hero card shows: AQI (Air Quality Index — 1 Good · 2 Fair · 3 Moderate · 4 Poor · 5 Very Poor), UV Index, Pressure (hPa), Cloud Cover (%), and Visibility (km).
Five cards showing the next 3 h, 6 h, 9 h, 12 h and 15 h forecast. Each card shows: weather icon, temperature, humidity, and the target time in IST.
A scrollable horizontal row of bubbles, one per logged observation. Each bubble shows the time (IST) and the sky condition icon. Hover a bubble to see the full description and temperature.
The Trends page shows up to 48 hours of actual weather observations overlaid with multi-hour forecast lines for a selected location. Every chart parameter has its own panel that can be expanded or collapsed independently.
- Use the Location dropdown at the top to pick a monitored site.
- Use the Range buttons (2h, 6h, 12h, 24h, 48h) to zoom the x-axis.
- The Forecast toggle buttons (+3h … +18h) overlay or hide individual forecast slot lines.
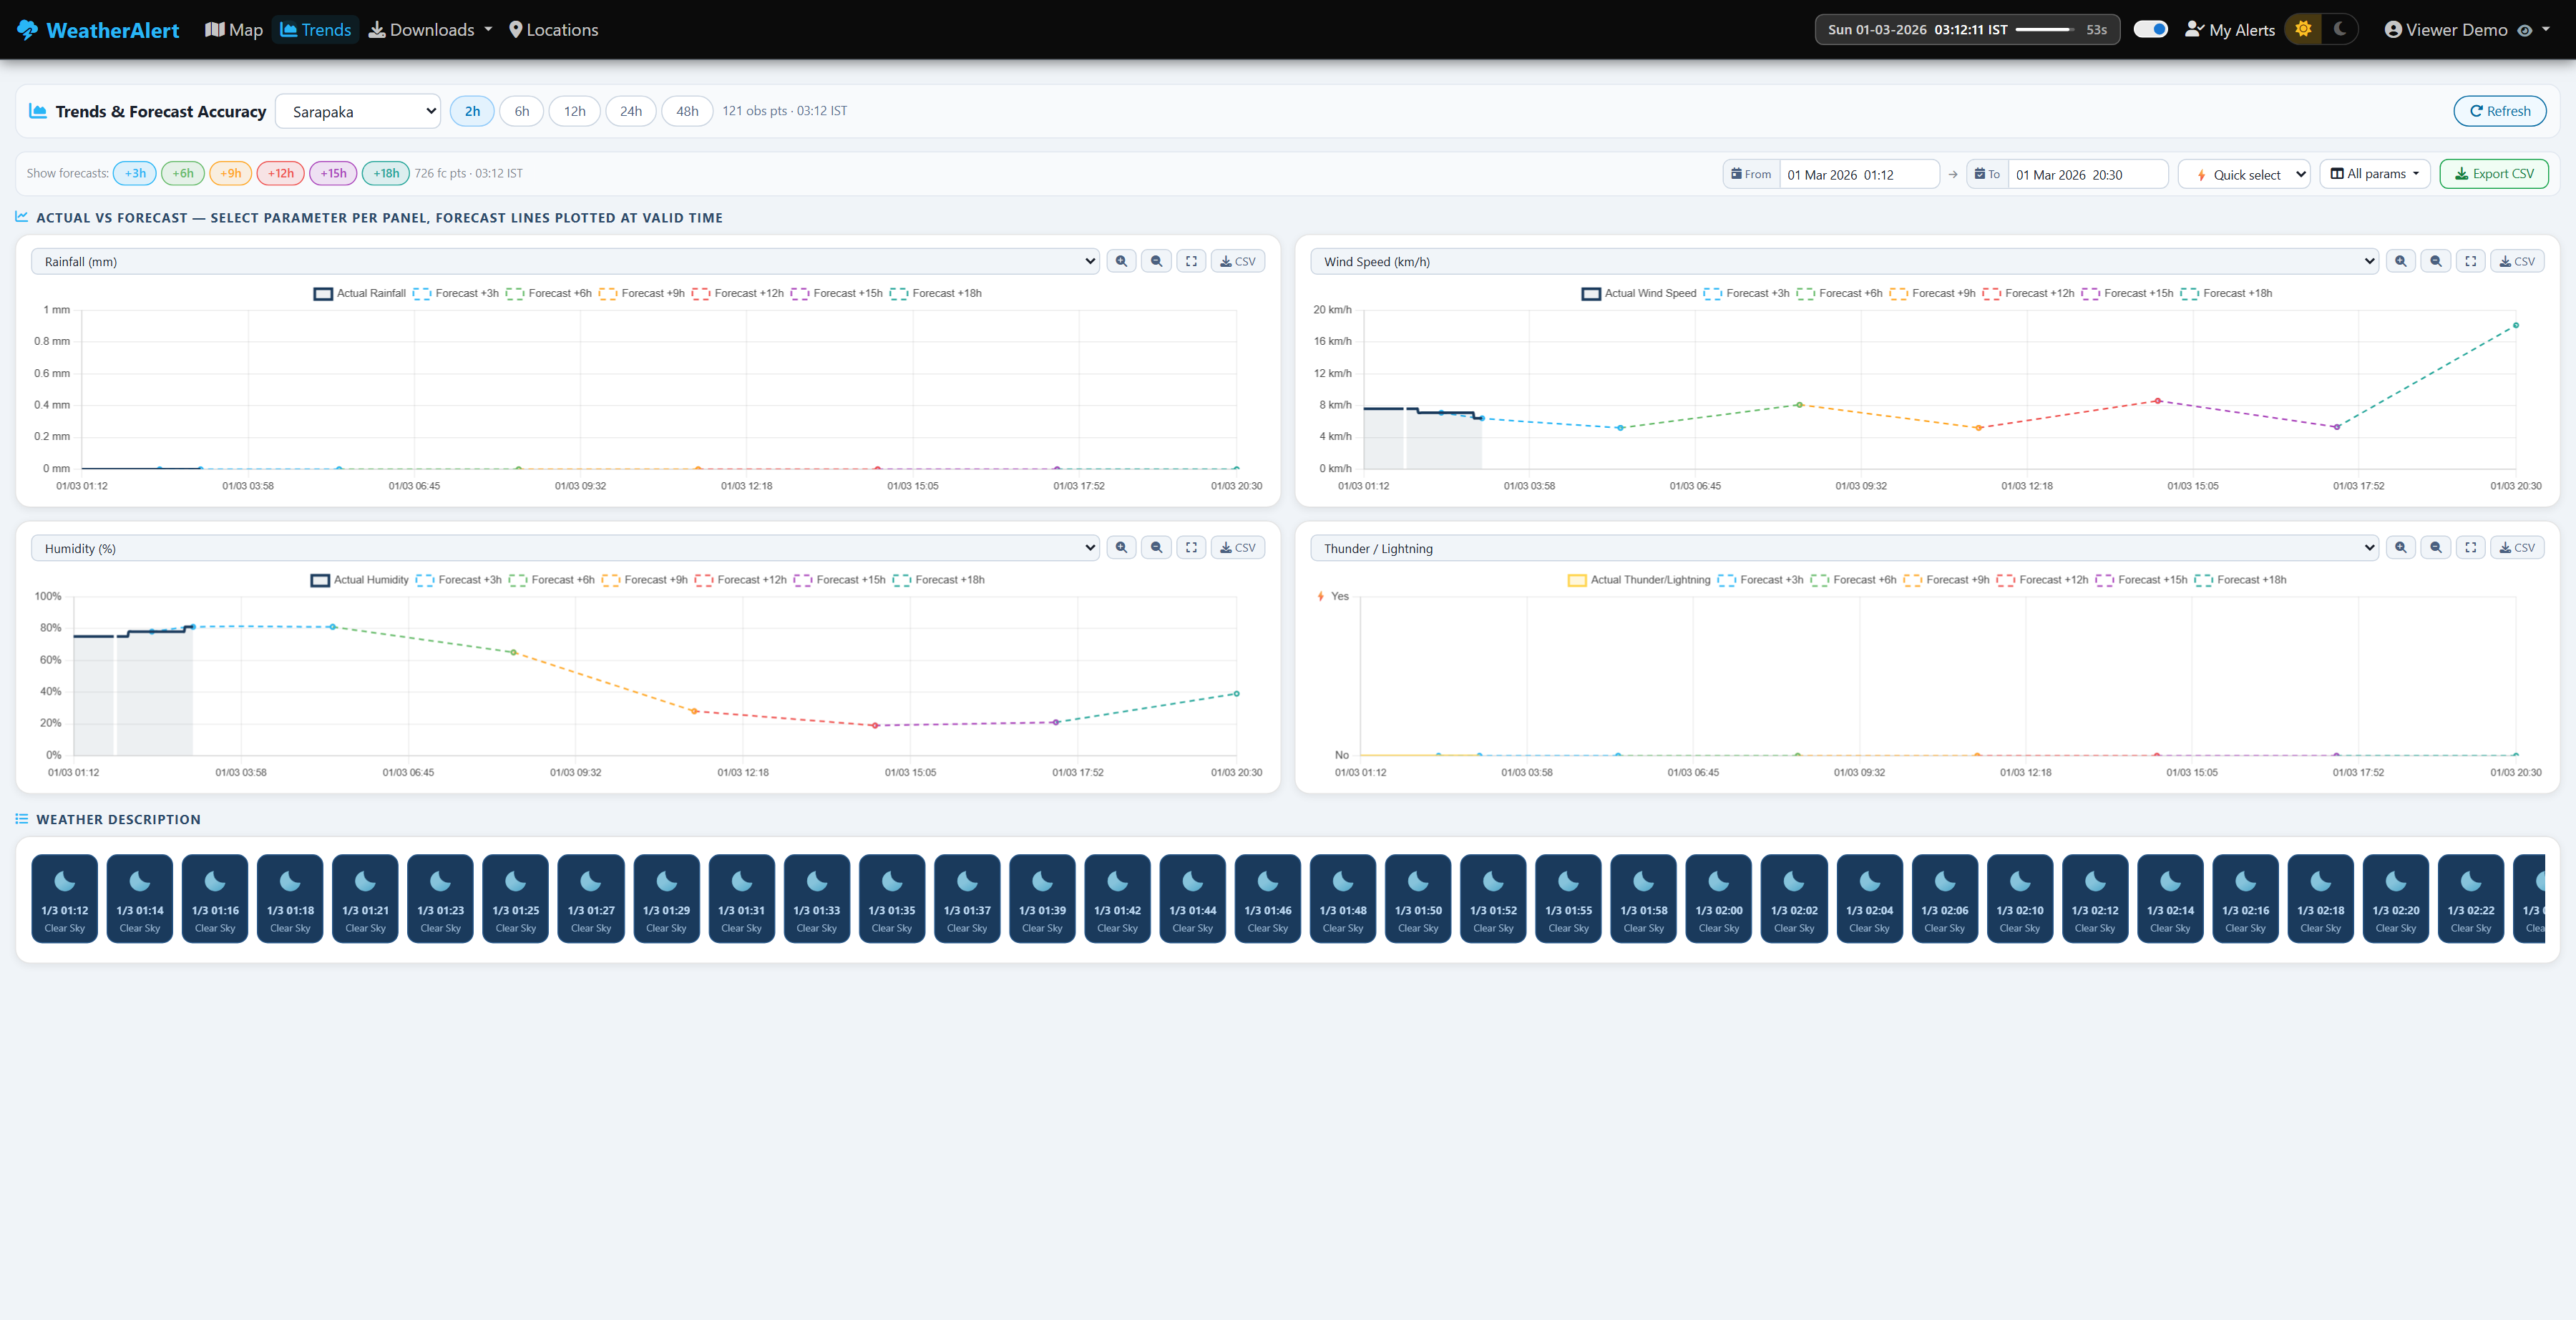
- The solid line is the actual recorded observation.
- Dashed coloured lines are forecast predictions at their valid time (e.g. "+9h" = value predicted 9 hours into the future).
- Hover anywhere on the chart to see a tooltip with all values at that timestamp.
- Use the legend chips at the top of each chart to show/hide individual lines.
- Scroll or pinch-zoom inside the chart; double-click to reset zoom.
CSV export is available to Registered Users and above only — it is not accessible to unauthenticated (Viewer) sessions.
Use the From / To date-time pickers or the Quick Select dropdown (Last 2h, 6h, 24h, etc.) to set a time range, then click Download CSV to export raw observations for that location and range. The export does not affect the chart display.
Click the ≡ Parameters button to choose which columns appear in the CSV.
The bottom section of the Trends page shows the same timeline bubble strip as the Dashboard, but spanning the full selected history window.
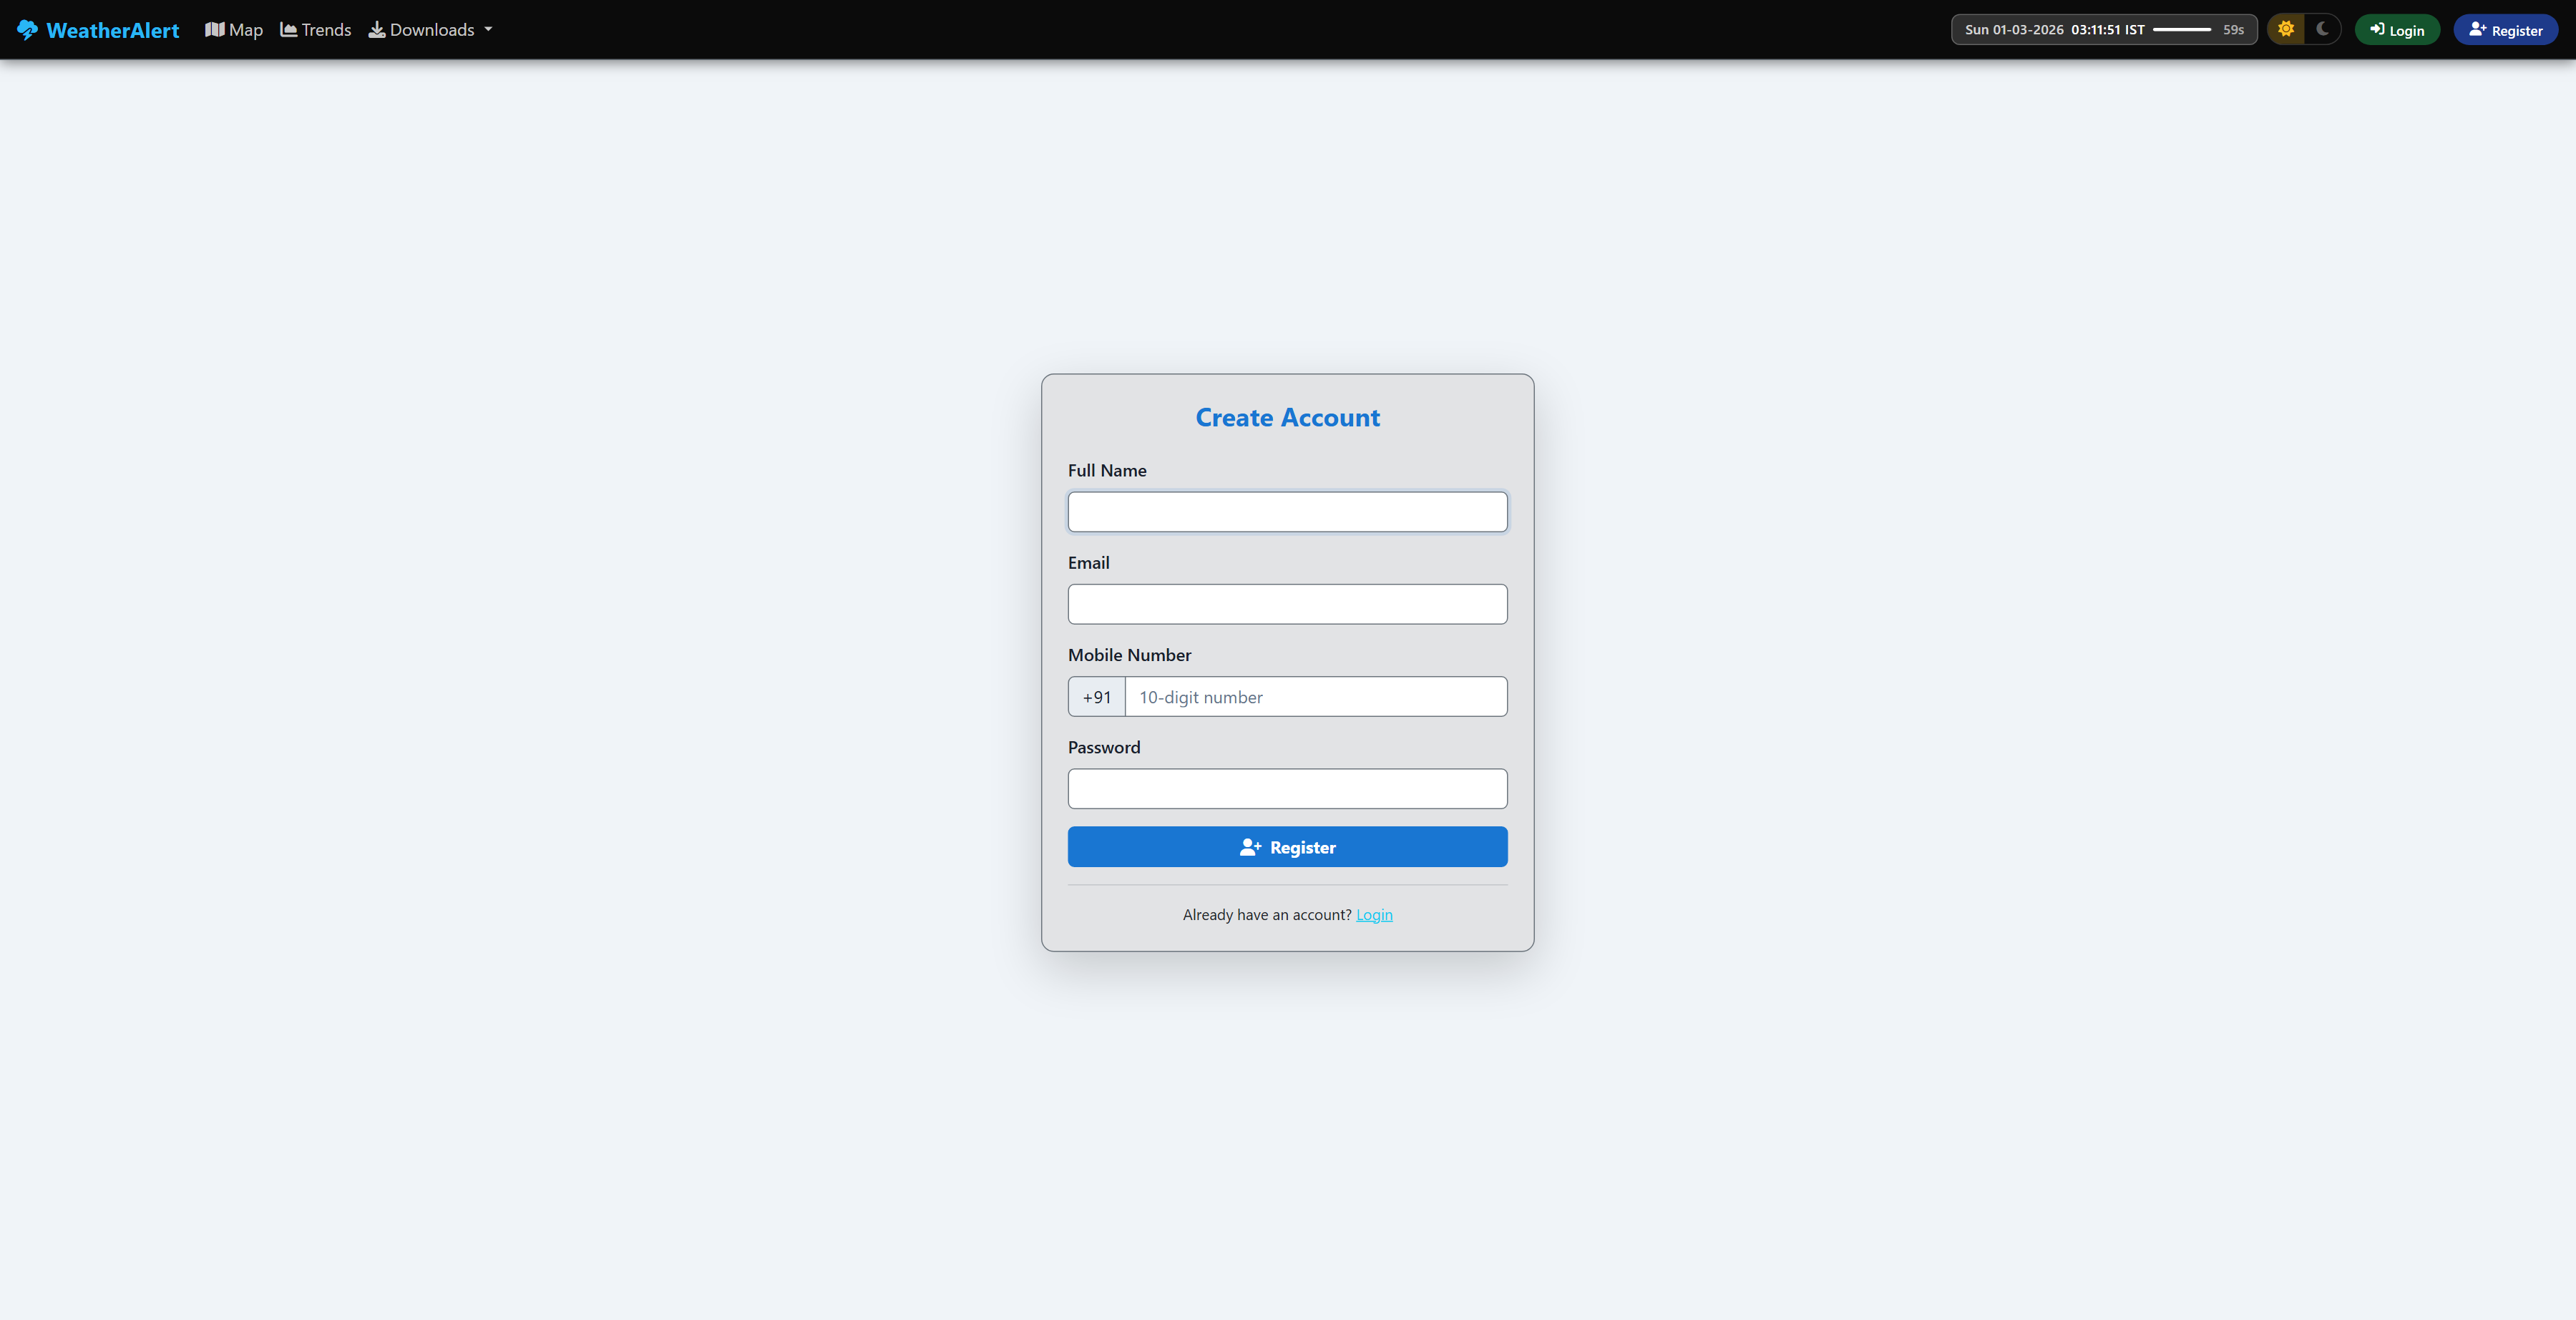
- Click Register in the top-right of the navbar.
- Enter your full name, a valid email address, and a password (minimum 6 characters).
- Submit the form. A verification email will be sent to your address.
- Open the email and click the Verify Email link (valid for 1 hour).
- Return to the site and log in with your credentials.
- Click Login in the navbar.
- Enter your email and password.
- Click Login. You will be redirected to the Dashboard.
- On the Login page click Forgot password?
- Enter your registered email and click Send Reset Link.
- Open the email and click the reset link (valid for 1 hour).
- Enter and confirm your new password.
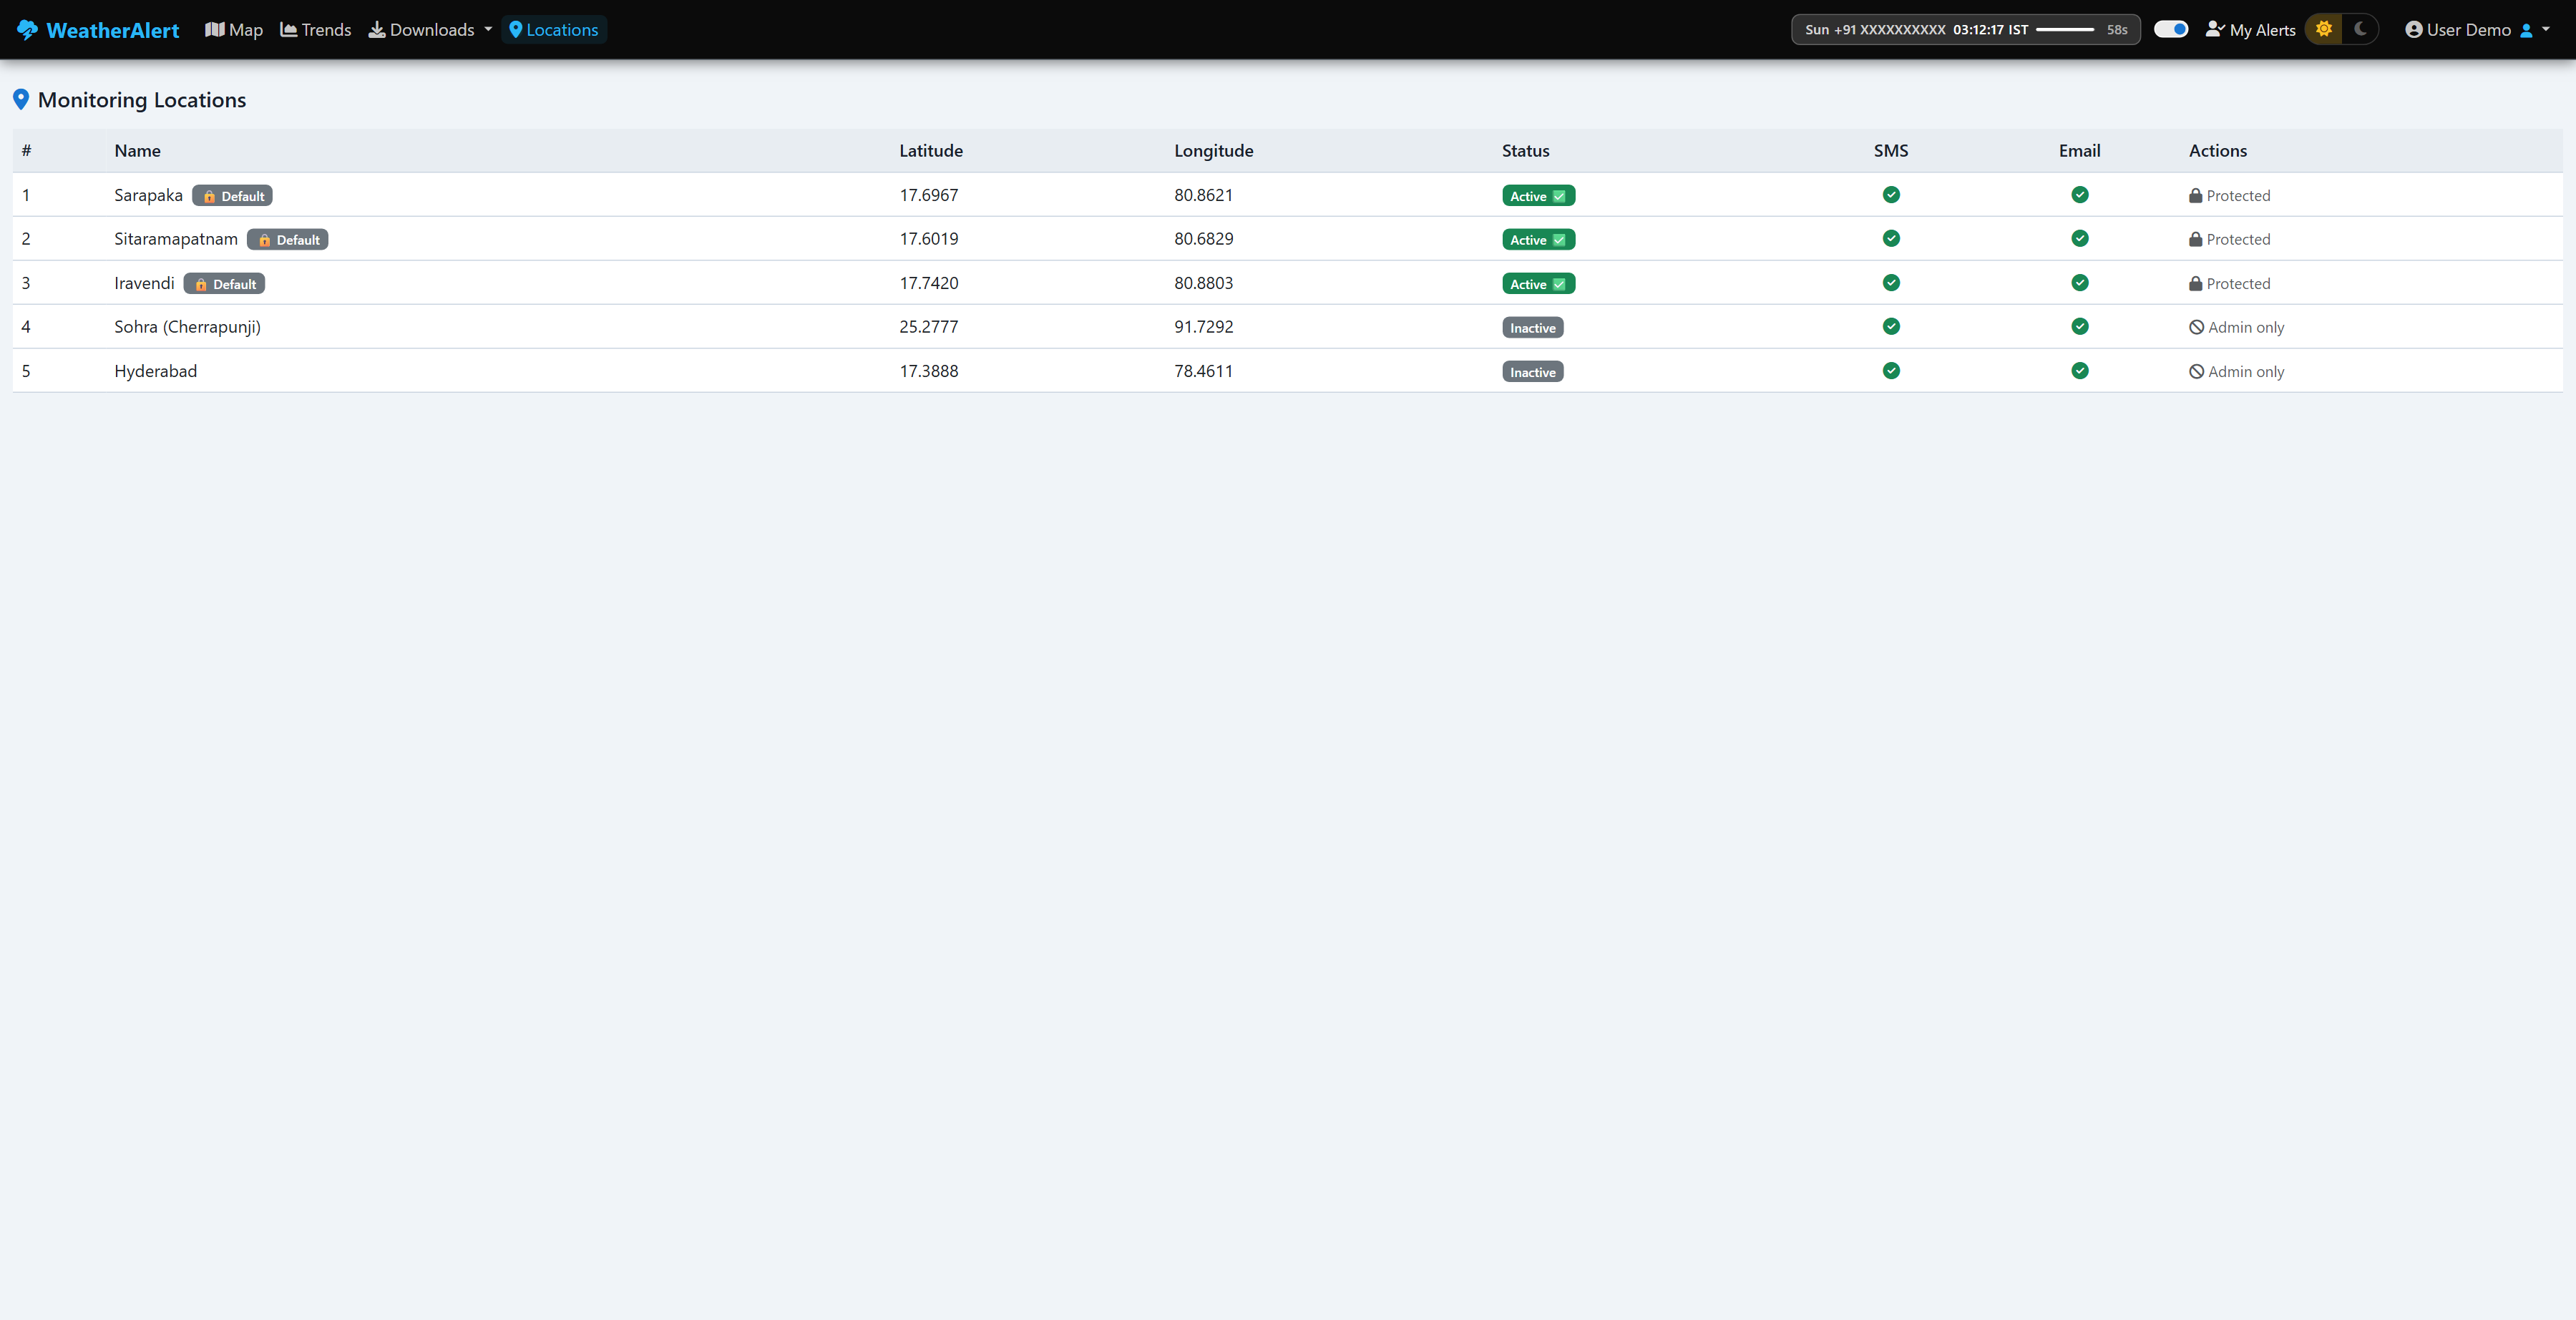
The Locations page lists all monitored sites. Click Locations in the navbar to open it. Default locations (Sarapaka, Sitaramapatnam, Iravendi) are pre-seeded.
Registered users can view the list and see which locations are active, but cannot add, delete, activate/deactivate, or change alert channels — those actions require Admin access (see Location Management below).
The My Alerts toggle in the navbar controls whether you personally receive alert notifications. It does not affect any other user.
- When ON — you will receive email and/or SMS alerts when a threshold is breached at your configured locations.
- When OFF — no alerts are sent to you, regardless of system settings.
Access your profile via the user dropdown in the top-right navbar → Profile.
- Name & Email — displayed (email cannot be changed after registration).
- Phone Number — required for SMS alerts. Enter in international format, e.g.
+919876543210. - Alert Channels — choose how you receive alerts:
Option What it does Email & SMS Alerts sent to both your email address and mobile number Email Only Alerts sent to your email address only SMS Only Alerts sent to your mobile number only (phone number required) None No alerts delivered (equivalent to turning My Alerts off) - Change Password — enter current password plus new password twice and click Save.
- Role badge — shown on the profile card; promoted by Superadmin only.
Admins can add, remove, activate/deactivate, and configure alert channels for locations. All changes take effect on the next monitor poll.
- Go to Locations in the navbar.
- Click Add Location or click a point on the map to auto-fill coordinates.
- Enter a name, latitude, and longitude.
- Click Save. The new location appears immediately in the list, the Dashboard, and the Trends page.
Click the Delete button on a non-default location card. Default locations (Sarapaka, Sitaramapatnam, Iravendi) are protected and cannot be deleted.
Toggle the Active switch on any non-default location card. When inactive, the monitor skips that location — no data is collected and no alerts fire. The location is retained and can be reactivated at any time.
Each location can send alerts via Email, SMS, both, or neither. Click the channel badge on the location card to toggle it.
The Global Alerts toggle is visible in the navbar for Admins and Superadmins only. It is the master on/off switch for the entire alerting system.
- When OFF — no alerts fire for any user or location, regardless of individual settings.
- When ON — alerts are fired normally, subject to per-user and per-location settings.
Navigate to Thresholds in the navbar to configure the conditions that trigger alerts. These settings apply globally to all locations.
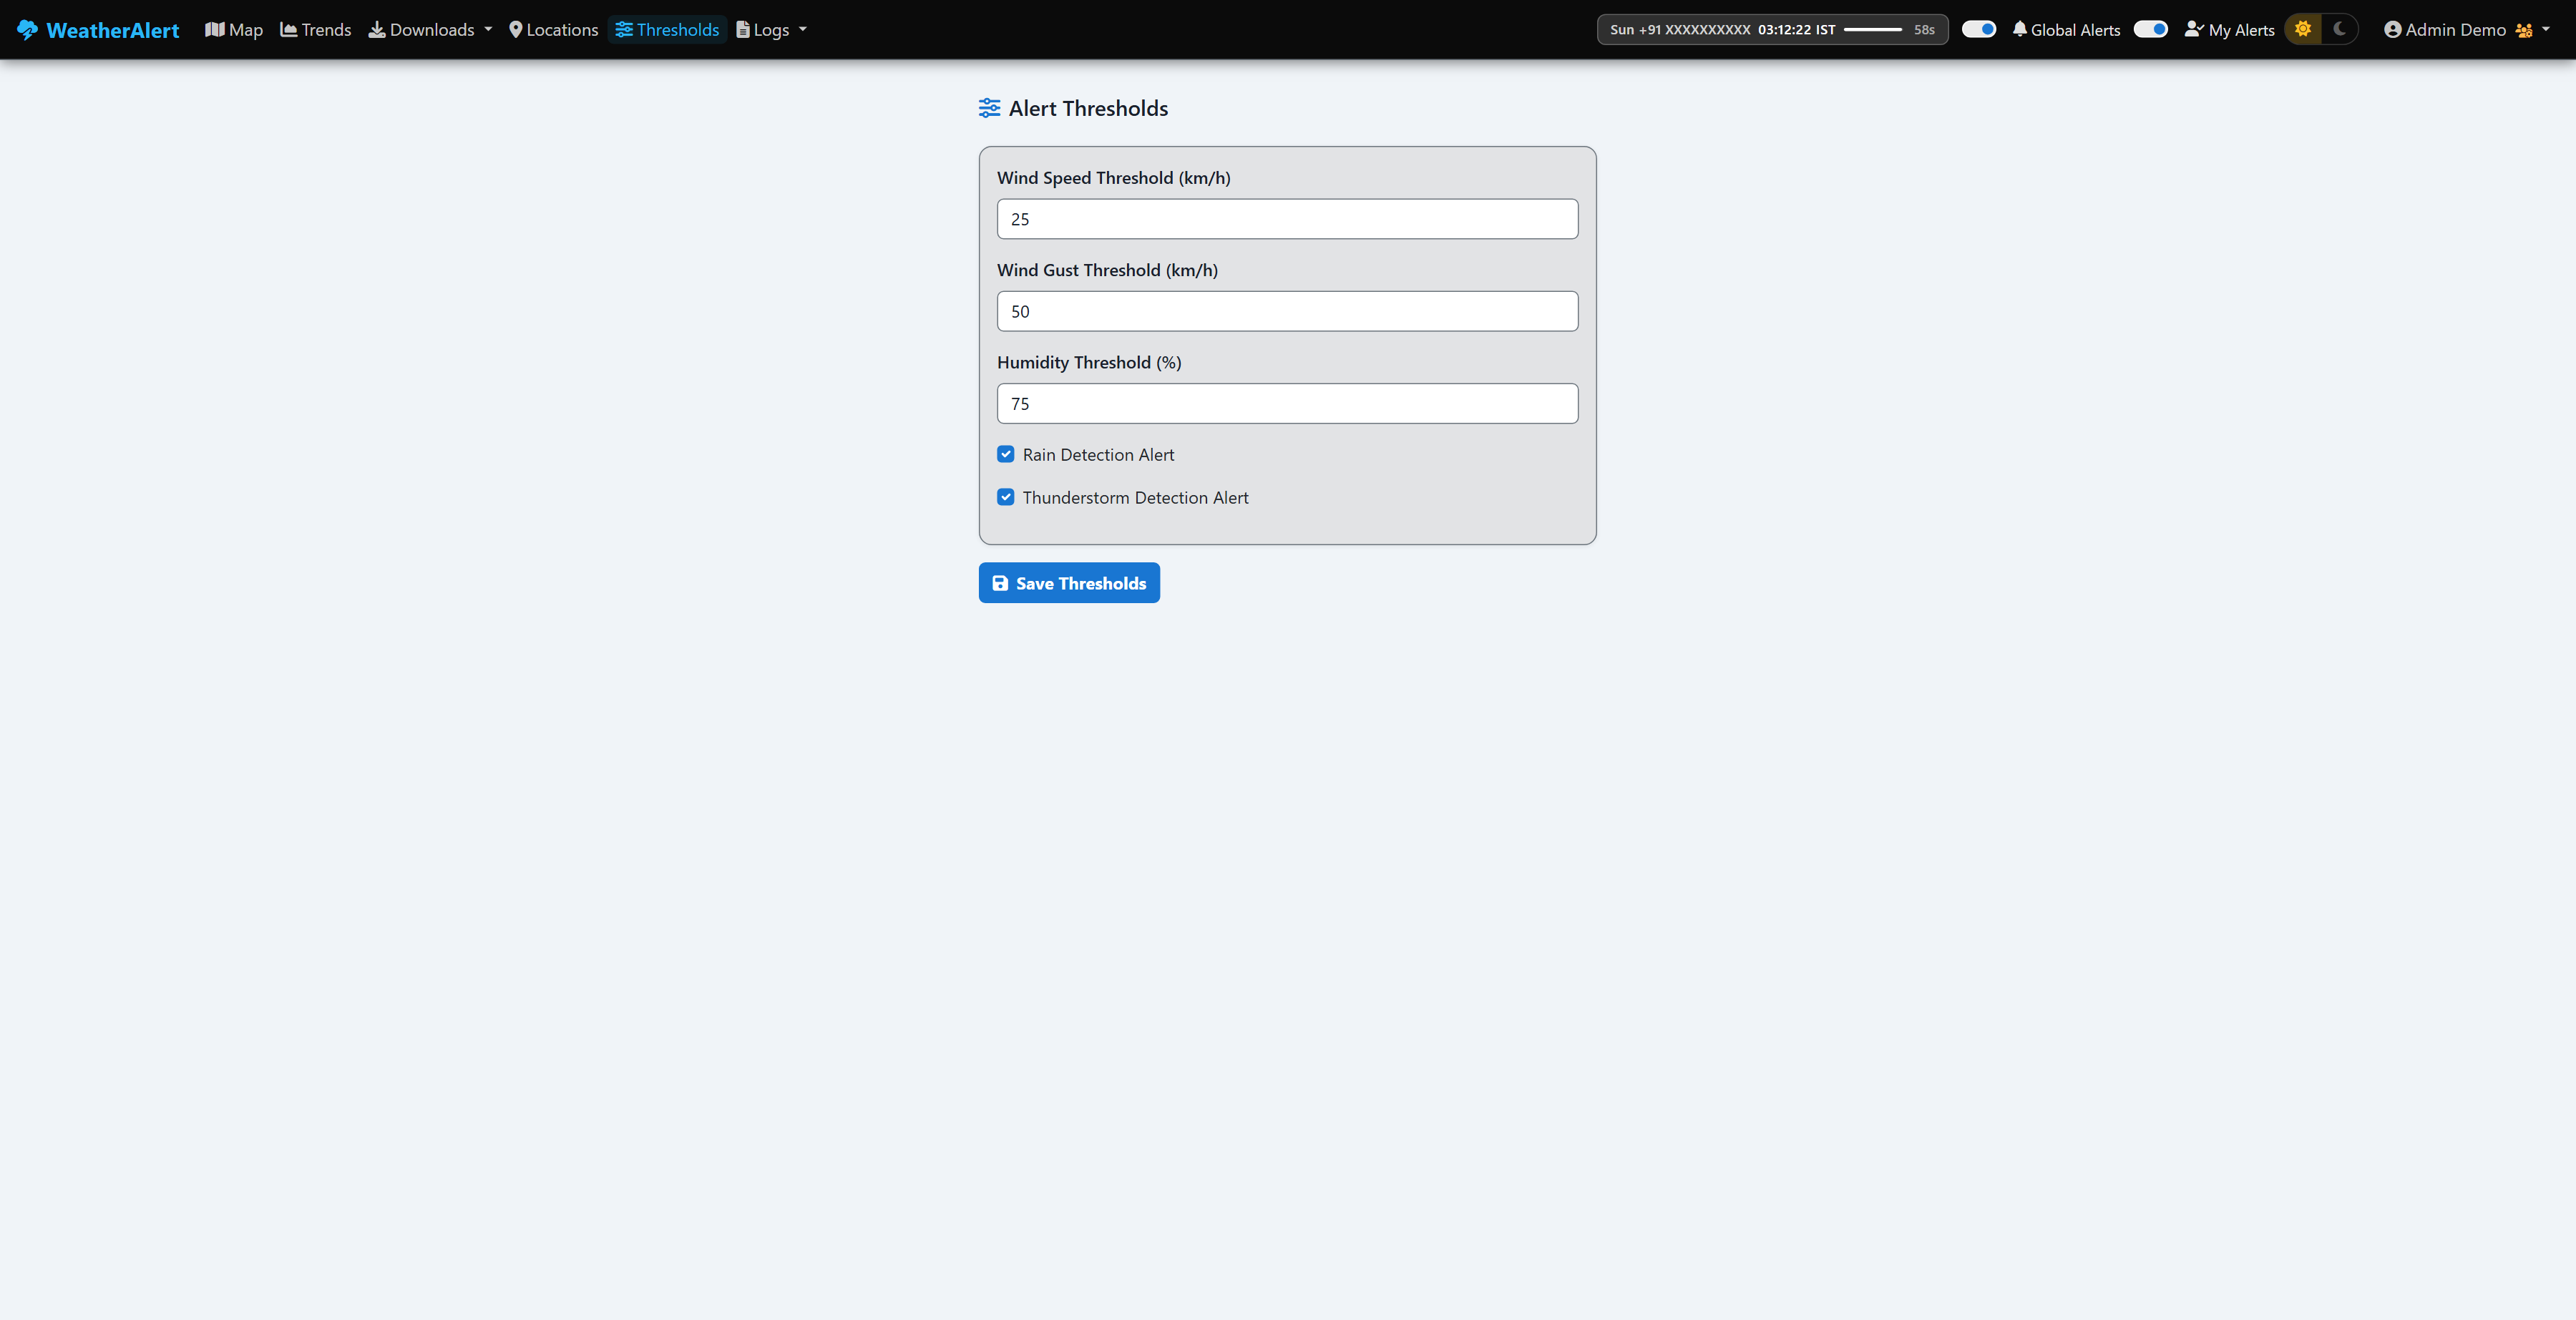
| Field | Unit | Default | Notes |
|---|---|---|---|
| Wind Speed | km/h | 60 | Sustained wind at 10 m height |
| Wind Gust | km/h | 80 | Maximum instantaneous gust |
| Humidity | % | 90 | Relative humidity |
| Rain Detection | checkbox | On | Any measurable precipitation in the 1h bucket |
| Thunderstorm Detection | checkbox | On | OWM condition IDs 200–232 |
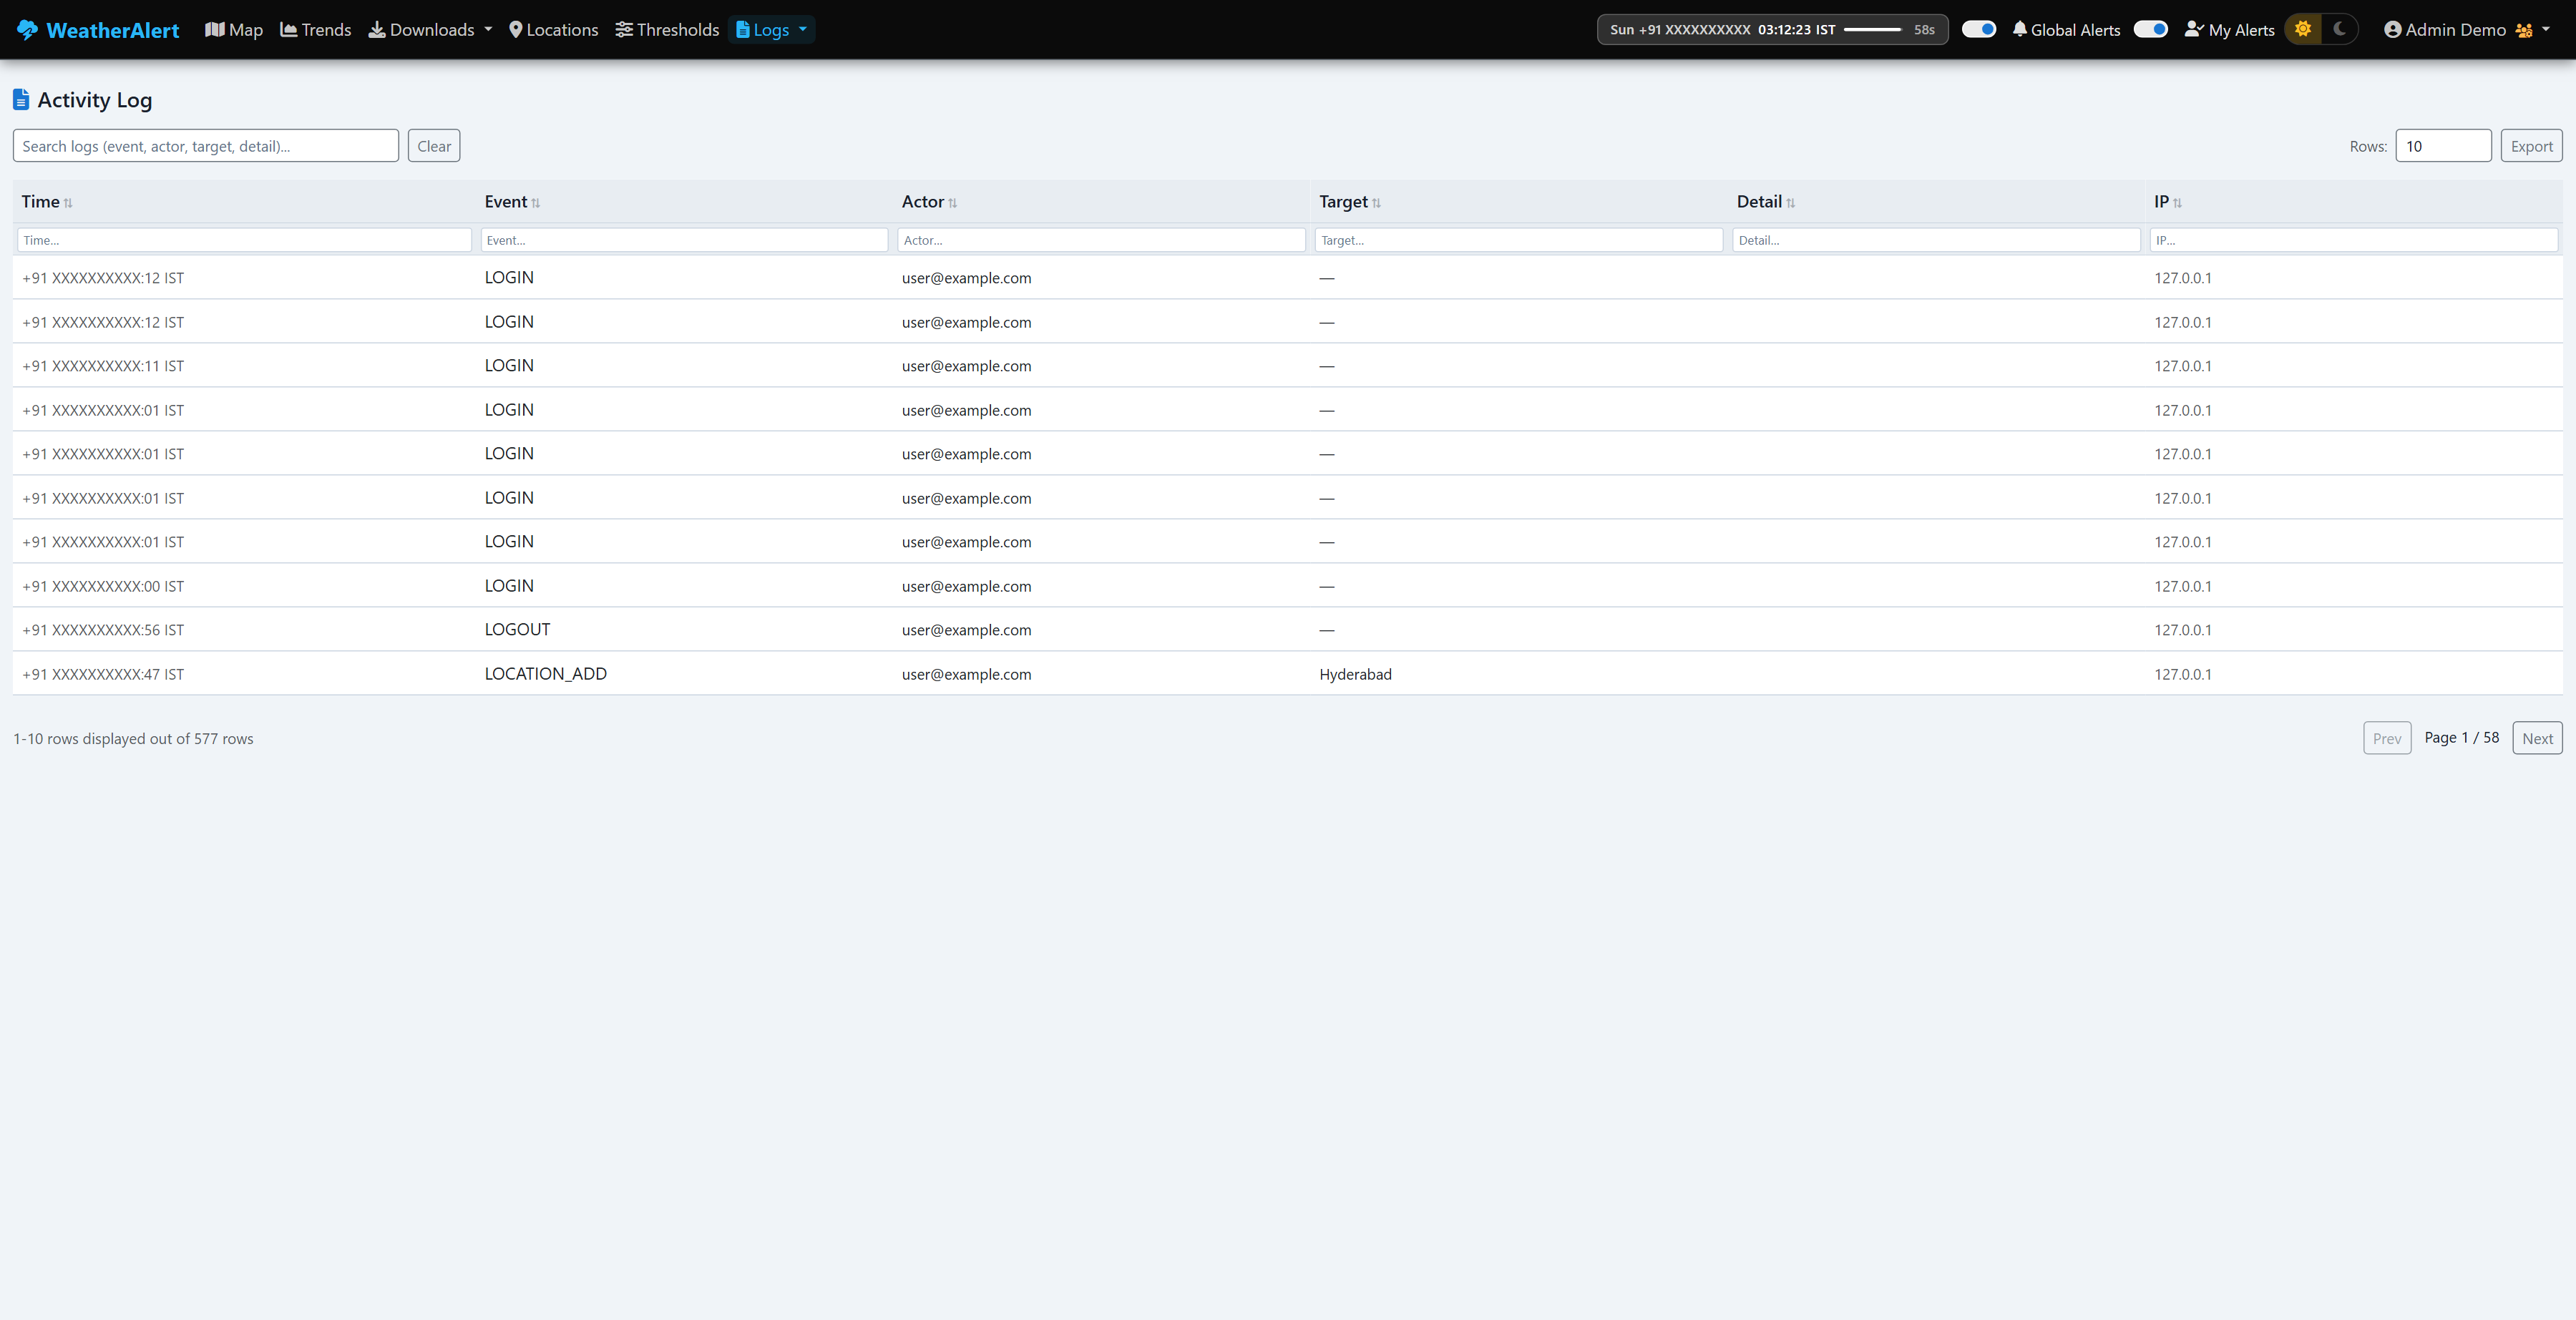
The Logs dropdown in the navbar contains three log viewers:
Records all significant events: logins, location changes, threshold edits, settings changes, and alert fires. Each row shows timestamp (IST), event type, actor (user or "system"), target, detail, and the originating IP address.
Lists every SMS alert dispatched via Twilio, including the destination number, location name, trigger reason, and delivery status.
Lists every email alert sent, including recipient, subject, location, trigger reason, and send status.
Navigate to Users in the navbar to view and manage all registered accounts.
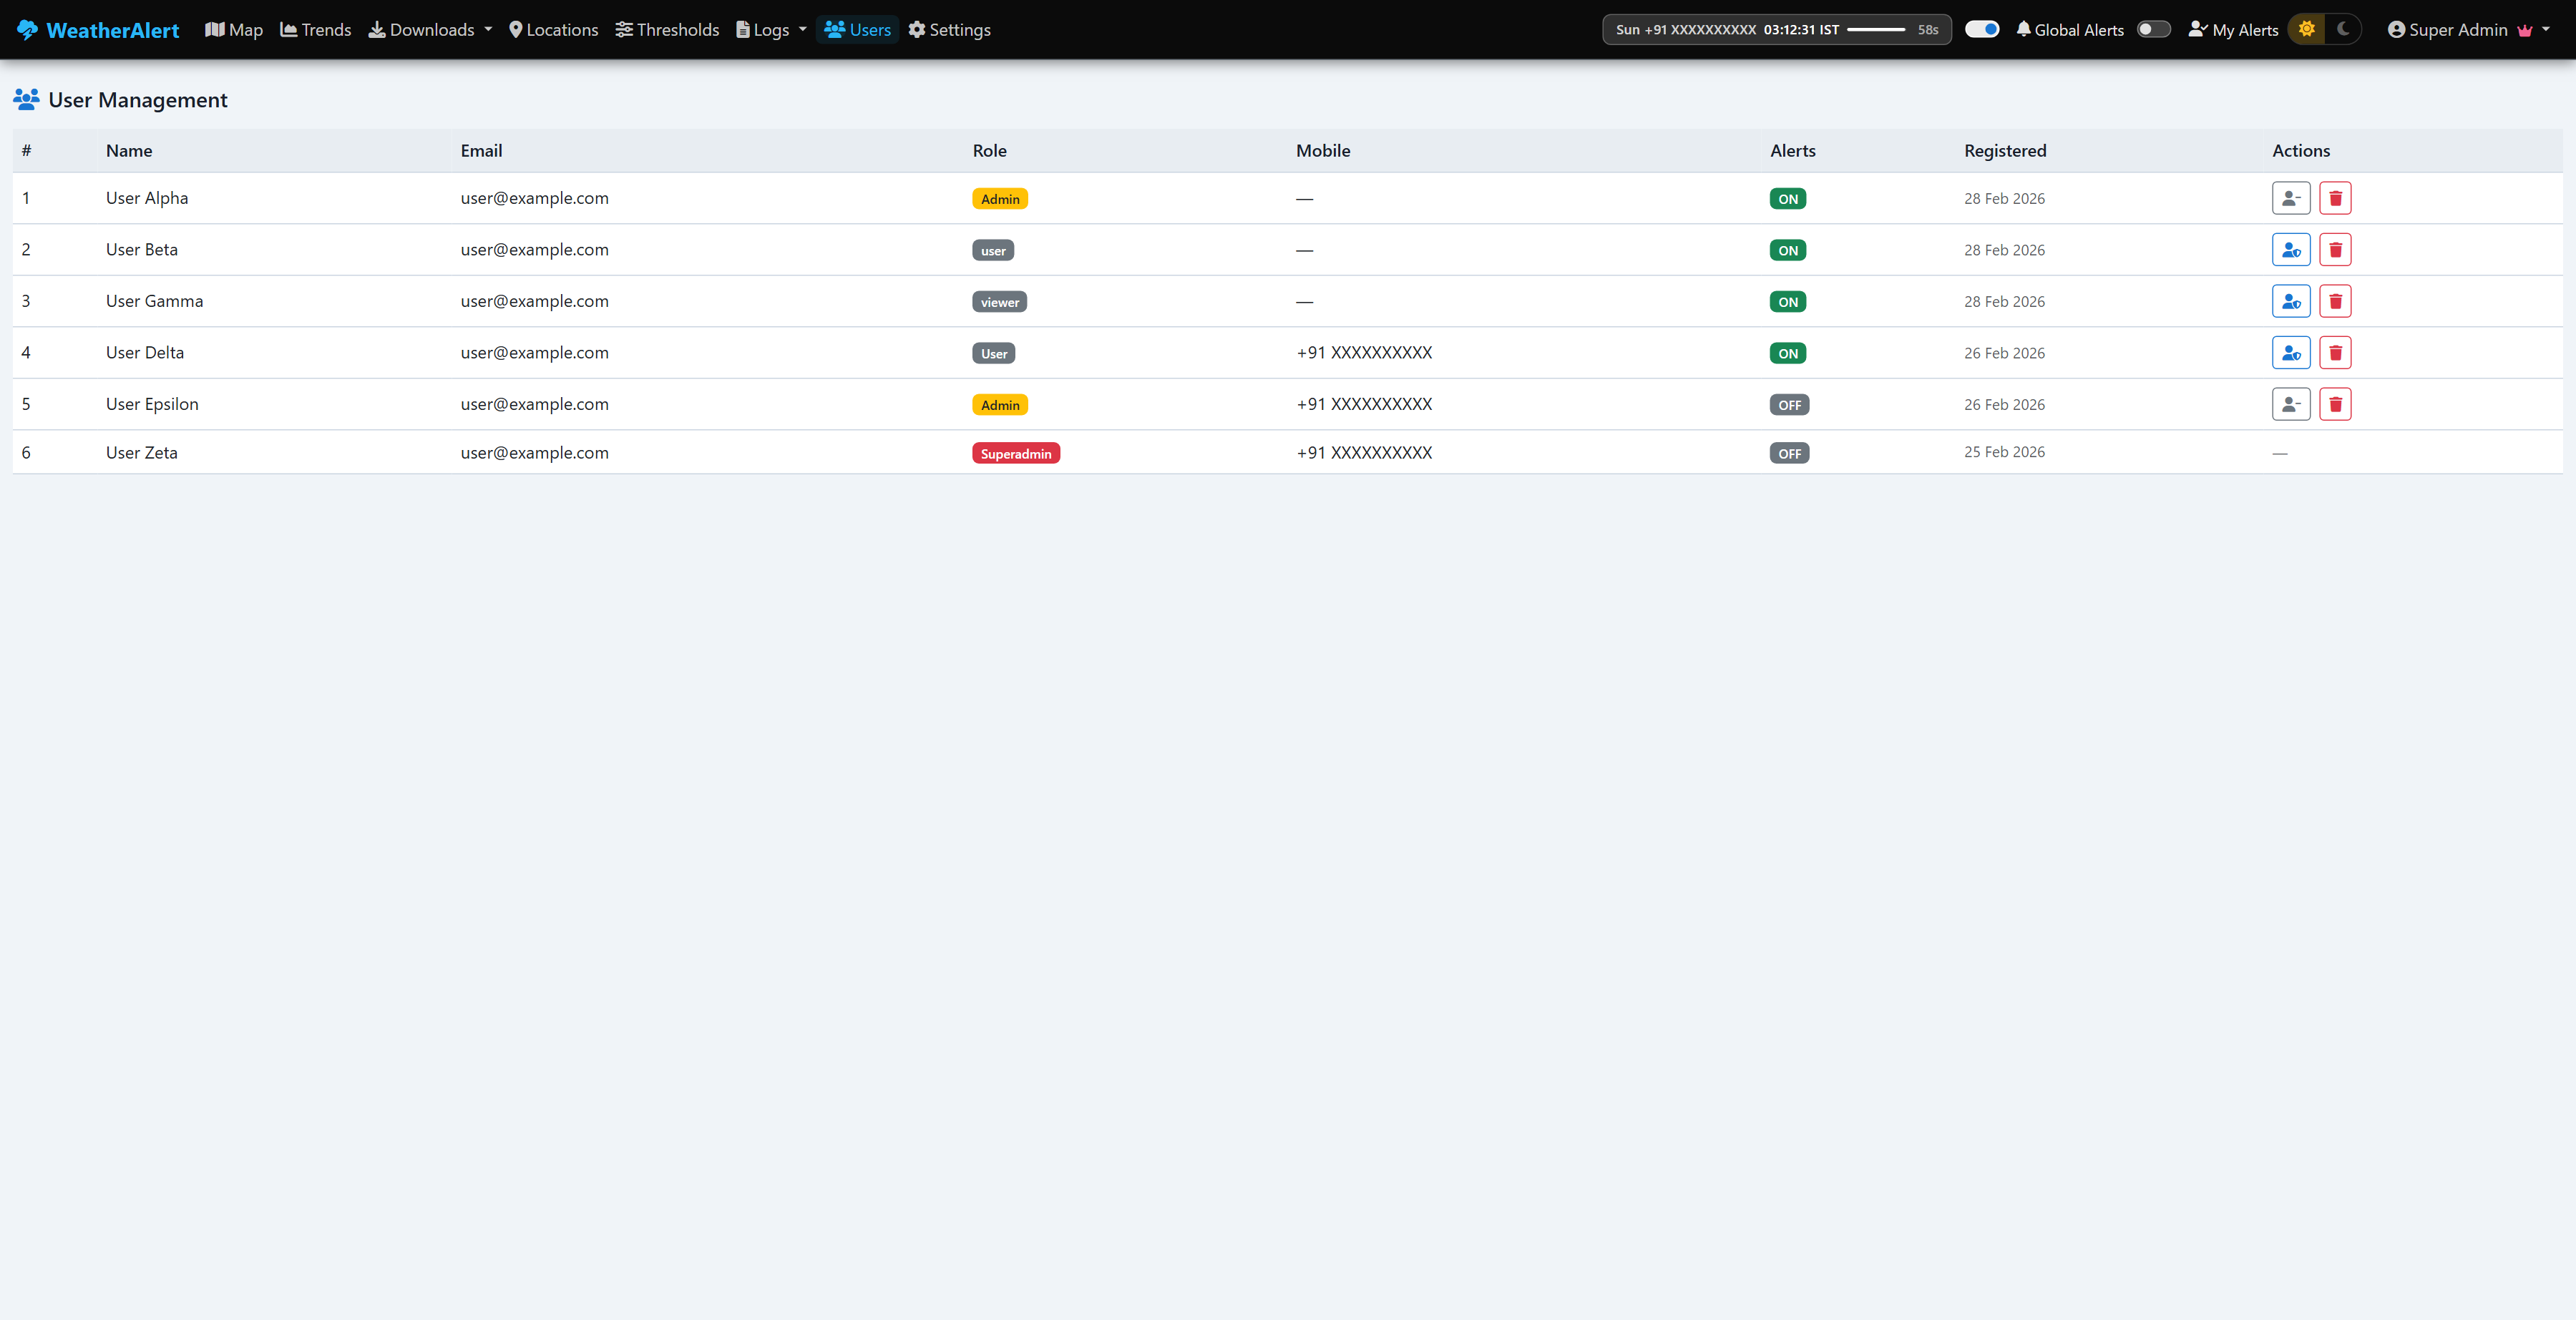
Each row shows the following columns:
| Column | Description |
|---|---|
| # | Sequential row number |
| Name | User's display name |
| Registered email address | |
| Role | Colour-coded badge — viewer / user / Admin / Superadmin |
| Mobile | Phone number if provided, otherwise — |
| Alerts | ON or OFF — the user's personal alert toggle state |
| Registered | Account creation date |
| Actions | Role toggle + Delete buttons (see below) |
Each non-Superadmin row (other than your own) has two action buttons:
| Button | Icon | When shown | Effect |
|---|---|---|---|
| Promote to Admin | (yellow outline) | User is Viewer or User | Immediately upgrades the user's role to Admin |
| Demote to User | (grey outline) | User is Admin | Immediately downgrades the user's role back to User |
| Delete | (red outline) | Any non-Superadmin row | Permanently removes the account after a confirmation prompt |
Navigate to Settings in the navbar for global system configuration.
| Setting | Description |
|---|---|
| OpenWeather API Key (Primary) | Primary key for fetching live weather and forecast data from OpenWeatherMap. |
| OpenWeather API Key (Alt / Fallback) | Fallback key used automatically if the primary key hits a rate limit or errors. |
| Twilio Account SID | Twilio account identifier required for SMS dispatch. |
| Twilio Auth Token | Secret token that authenticates SMS API calls. |
| Twilio From Number | The Twilio-provisioned number used as the SMS sender. |
| Gmail User | Gmail address used to send alert emails. |
| Gmail App Password | App-specific password (not your Gmail login password) generated in Google Account → Security. |
| Alert From Address | The "From" address that appears in alert emails sent to users. |
| Polling Interval (sec) | How often the monitor fetches fresh weather data for every active location. Minimum recommended: 30 s. |
| Alert Cooldown (sec) | After an alert fires for a location+condition pair, this many seconds must pass before the same alert fires again. Prevents notification floods. |
Use the sun / moon pill in the top-right of every page. Click the sun icon for Light mode or the moon icon for Dark mode. Your preference is saved in a browser cookie and persists across sessions.
Forecasts are issued by the API every 3 hours, so each forecast slot (e.g. +9h) only has data points spaced 3 hours apart. Observations are recorded every 30–60 minutes. Chart.js bridges the null gaps with straight lines, which can look like a visual break when the forecast starts. This is expected behaviour and is data-faithful.
- Confirm Global Alerts is ON in the navbar (admin view).
- Confirm My Alerts is ON in your navbar.
- Check that the affected location has Email channel enabled on the Locations page.
- Verify your email address is correct in your Profile.
- Check the Email Log (Logs → Email Log) to see if sends are being attempted and what status they return.
- Check all the same toggles as for email above.
- Confirm your phone number in Profile is in international format (
+91XXXXXXXXXX). - Check the SMS Log for Twilio error codes.
This usually means the background monitor has not yet collected data for that location. Wait until the next poll cycle (watch the countdown bar in the navbar).
The system automatically prunes records older than 31 days during each monitoring cycle.
| Term | Meaning |
|---|---|
| IST | Indian Standard Time (UTC +5:30). All display timestamps use IST; data is stored in UTC internally. |
| OWM / OpenWeather | OpenWeatherMap API — the data source for all current weather and forecast data. |
| Forecast slot | A future time offset, e.g. "+9h" means a forecast valid 9 hours after the issue time. |
| forecast_dt | The timestamp a forecast is valid for (issue time + slot hours). Used as the x-axis position on Trend charts. |
| AQI | Air Quality Index (1 = Good … 5 = Very Poor) sourced from the OWM Air Pollution API. |
| Poll interval | How often (seconds) the background thread fetches fresh data from OWM. |
| Cooldown | Minimum time between repeated alerts for the same location + condition. Prevents spam. |
| Global Alerts | Master on/off switch for all outbound notifications (email + SMS). |
| My Alerts | Per-user toggle for whether that individual receives notifications. |
| Default location | Pre-seeded location (cannot be deleted). Currently: Sarapaka, Sitaramapatnam, Iravendi. |